Combine varpred objects
combinevarpred.RdCombines and plots comparison plots for more than two named varpred objects.
Arguments
- vlist
a list of
varpredobjects.- lnames
a character vector specifying the name(s) of the vlist objects. Useful when faceted comparison is needed. See examples.
- plotit
logical. If
TRUEa plot is returned, otherwise avarpredobject.- addmarginals
logical. If
TRUEthe mean of the estimates is added to the plot.- margindex
an integer vector indexing the
vlist. Useful if particularvlistneeds to be averaged together in theaddmarginals.- ...
additional arguments passed to
plot.varpred.
Examples
# Set theme for ggplot. Comment out if not needed
library(ggplot2)
varpredtheme()
set.seed(911)
# Simulate binary outcome data with two predictors
steps <- 500
N <- 100
b0 <- 2
b_age <- -1.5
b_income <- 1.8
min_age <- 18
age <- min_age + rnorm(N, 0, 1)
min_income <- 15
income <- min_income + rnorm(N, 0, 1)
eta <- b0 + age*b_age + income*b_income
status <- rbinom(N, 1, plogis(eta))
df <- data.frame(status, age, income)

# Fit model
mod <- glm(status ~ age + income, df, family=binomial())

# Effect plots
## Mean-based
ef_mean <- varpred(mod, "age", steps=steps, bias.adjust="none", modelname="mean-based")
## Observed-value-based
ef_observed <- varpred(mod, "age", steps=steps, bias.adjust="observed", modelname="observed-value")
## Combine all the effect estimates
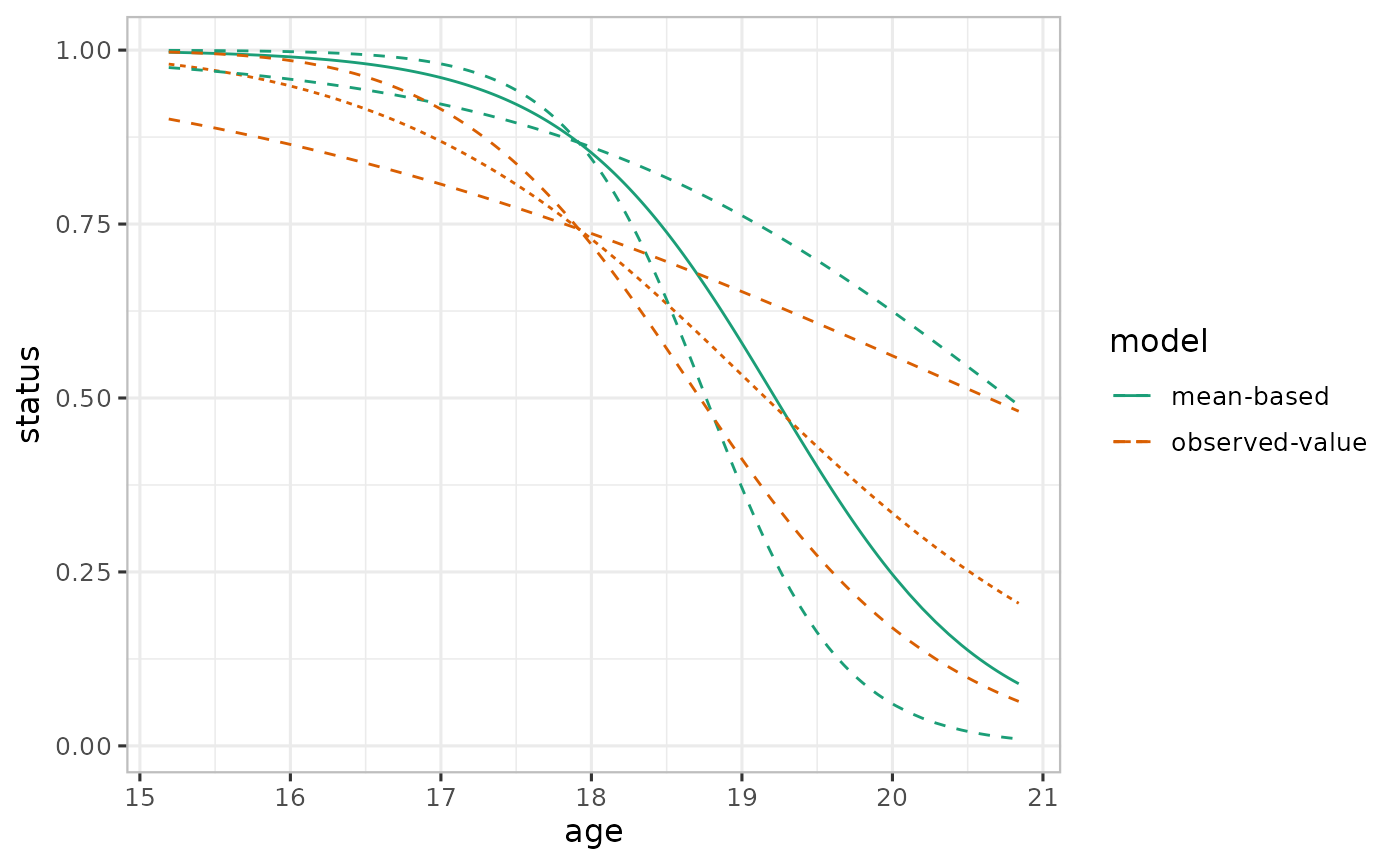
ef <- combinevarpred(list(ef_mean, ef_observed))
print(plot(ef)
  + scale_color_brewer(palette = "Dark2")
)
#> Scale for 'colour' is already present. Adding another scale for 'colour',
#> which will replace the existing scale.


# Prediction plots
## Mean-based
pred_mean <- varpred(mod, "age", isolate=FALSE
  , steps=steps, bias.adjust="none"
  , modelname="mean-based"
)
## Observed-value-based
pred_observed <- varpred(mod, "age", isolate=FALSE
  , steps=steps, bias.adjust="observed"
  , modelname="observed-value"
)
## Combine all the prediction estimates
### With plotit=TRUE no need to plot
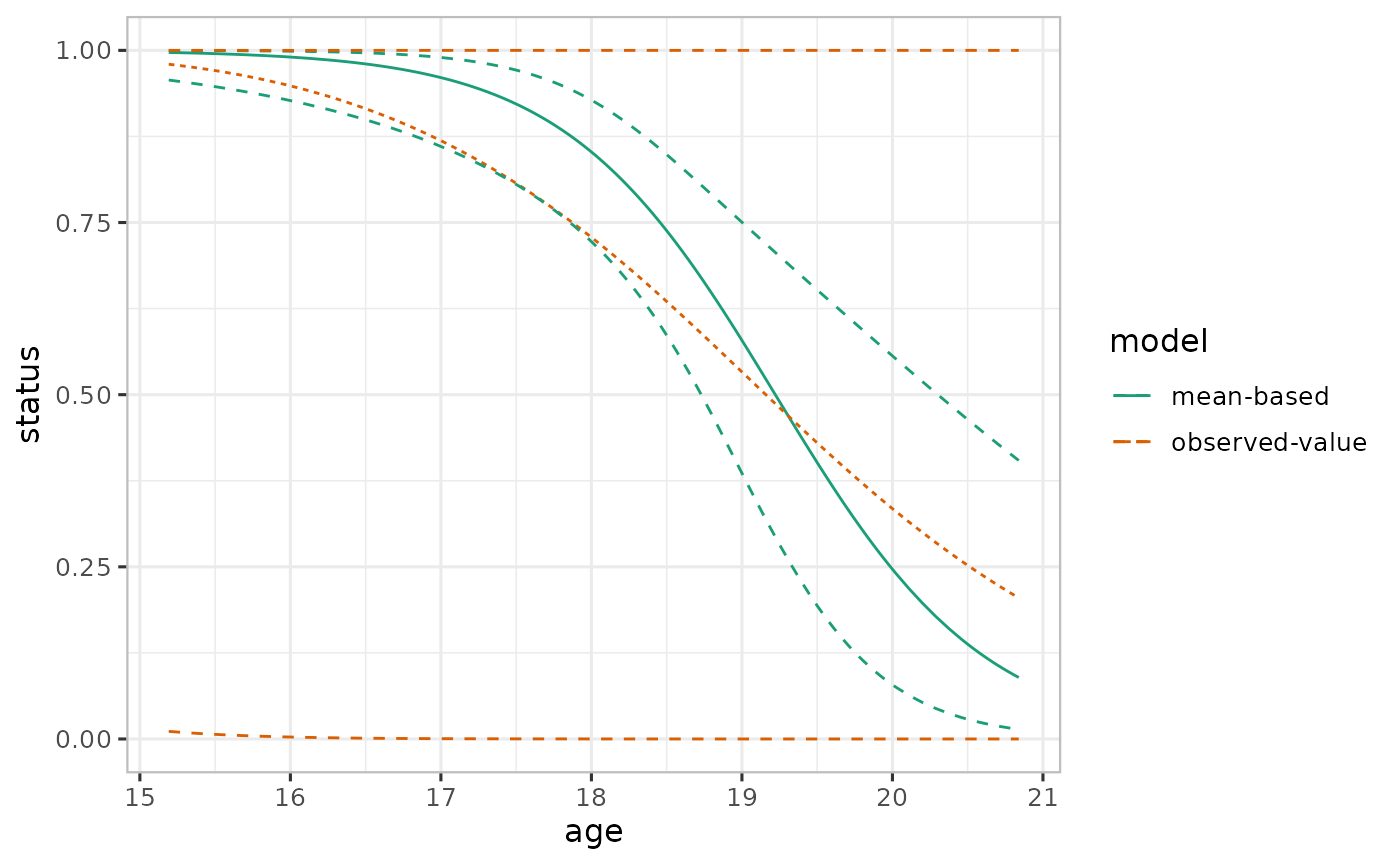
pred <- combinevarpred(list(pred_mean, pred_observed), plotit=TRUE)
print(pred
  + scale_color_brewer(palette = "Dark2")
)
#> Scale for 'colour' is already present. Adding another scale for 'colour',
#> which will replace the existing scale.
